How to Connect External Data with Copilot
In the dynamic realm of data-driven decision-making, access to relevant, accurate, and timely data is paramount. Copilot Data Connectors are revolutionary, linking various data sources to assist in your evaluation.
This guide discusses Copilot Data Connectors. It explains how to use them, why they are important, and how they improve data workflows.
Understanding Copilot Data Connectors
Copilot Data Connectors are innovative tools designed to simplify and streamline data integration processes.
They help users easily access data from different sources like cloud platforms, databases, and applications. Copilot Data Connectors make it easier to retrieve and integrate data. This allows users to concentrate on gaining valuable insights rather than managing separate data sources.
How to Use Copilot Data Connectors
- Choose Your Data Source: Begin by identifying the data sources you wish to connect to. Copilot Data Connectors can link to a variety of sources. These include MySQL, PostgreSQL, and MongoDB databases. They can also connect to cloud platforms such as AWS, Google Cloud, and Microsoft Azure.
- Select the Connector: Once you've identified your data sources, select the appropriate Copilot Data Connector for seamless integration. Copilot offers a diverse range of connectors tailored to specific data platforms,
 ensuring compatibility and efficiency.
- Set up connection parameters: By entering authentication details, server information, and necessary settings. This will help create a secure and dependable connection to your data source.
- Retrieve and Transform Data: With the connection established, leverage Copilot Data Connectors to retrieve the desired datasets. Employ advanced data transformation capabilities to cleanse, enrich, and harmonize the data according to your diagnostic requirements.
To get the latest data for analyzing and reports, you can choose to turn on Real-Time Syncing for continuous updates. This will keep your insights up-to-date with the latest data from your sources.
You can connect the data with your favorite analytical tools. These tools include business intelligence dashboards, machine learning models, and custom applications. This allows for seamless integration and analyzing.
Why Connecting Your Data is Important
Integrating external data with Copilot extends the scope of analyzing, enabling organizations to gain a holistic view of their operations, customers, and competitive landscape. 
Here's why connecting external data with Copilot is crucial:
Enhanced Context and Insights
External data sources provide valuable context that enriches internal datasets. Companies can improve their understanding of customers, competition, and opportunities by using external information.
This information can include market trends, consumer behavior, and industry standards. By analyzing this data, companies can gain insights into what customers desire and potential risks they may face.
Better decision-making
Having access to different types of outside information helps make decisions based on real-world situations. Organizations can make better decisions by using external data. For example, they can adjust marketing plans based on social media feedback.
They can also enhance supply chain operations with weather predictions. Ultimately, this leads to improved business results. This leads to better business results.
Predictive Analytics and Forecasting
External data often contains signals and patterns that can enhance predictive analytics and forecasting models. Companies can improve their predictive models by using outside information such as economic data, population trends, and global events.
This can make their models more accurate and reliable. As a result, companies can plan and manage risks more effectively. This helps with planning and managing risks more effectively.
Competitive Advantage
Leveraging external data can provide a competitive edge by uncovering hidden opportunities or early warning signs of potential risks.
By using Copilot, organizations can stay ahead by spotting market trends early and tracking competitors online. Integrating external data helps them stay ahead of the competition.
Innovation and Adaptability
External data integration fosters innovation by enabling organizations to tap into new sources of insights and inspiration. Companies can find new market groups by analyzing data from outside sources. Additionally, they can generate new ideas for products and services.
Comprehensive Risk Management
External data sources play a critical role in risk management by providing early indicators of potential risks and vulnerabilities.
With Copilot, companies can use external data to anticipate and manage risks like supply chain problems and regulatory shifts. This helps prevent issues from getting worse.
Organizations can use Copilot to connect external data sources. This allows them to access a variety of data-driven insights. You can use these insights for decision-making, planning, and innovation.
By doing this, organizations can enhance their logical capabilities. Organizations can use outside data to discover new opportunities, lower risks, and stay ahead in today's fast-paced environment.
How Copilot Data Connectors Drive Seamless Data Connection
Efficiency and Productivity
Copilot Data Connectors streamline the data integration process, reducing manual effort and time spent on data preparation tasks. This efficiency enables data teams to focus on higher-value activities such as analyzing, modeling, and strategic decision-making.
Data Accessibility and Modification
By bridging data silos and simplifying access to disparate data sources, Copilot Data Connectors democratize data access across organizations. Business users, analysts, and data scientists can get the data they need without needing specialized technical skills.
Connecting external data with Copilot enables you to grow with your changing data needs, providing scalability and flexibility. Whether you're dealing with small-scale datasets or massive data volumes, Copilot's robust infrastructure ensures seamless growth and performance.
Copilot Data Connectors provide real-time insights for organizations. They help organizations access fresh data quickly. This allows them to make decisions faster. It also helps them respond promptly to market changes.
Ability and Affinity
Copilot Data Connectors support a wide range of data platforms and formats, ensuring compatibility with your existing infrastructure and tools. This interoperability eliminates data silos and fosters a cohesive data ecosystem within your organization.
In conclusion, Copilot Data Connectors represent a paradigm shift in data integration, offering unparalleled efficiency, accessibility, and scalability.
Your organization can use connector tools to easily connect data with Copilot for maximum data utilization. This helps them innovate and strategically grow in today's data-focused environment.
[vc_row][vc_column][vc_empty_space][vc_column_text]San Diego, CA, February 6, 2019. Athena San Diego hosted a panel of data privacy experts to discuss how changes in privacy, General Data Protection Regulation (GDPR) and California Consumer Privacy Act (CCPA) affect businesses in the US.
Data privacy experts that shared their knowledge and experience with the audience:
- Reem Allos, Senior Associate, KMPG
- Robert Meyers, Director of Systems Architecture, Managed Solution
- Marines Mercado, Sr Privacy Analyst, ResMed
- Chris Vera, Manager, Office of Customer Privacy, SDGE
The field of privacy is changing. Consumers are now demanding privacy and noticing how their data is being used, and as a result they are taking back the control over their own data. In addition, the laws are holding companies more accountable to respect the privacy of their consumers.
The reality is, data privacy laws are going to apply to your business sooner or later, no matter where you are in the world. Therefore, being informed and ready to comply with the laws is crucial for your business to thrive in the future and establish trust with your consumers.
Robert Meyers, Director of Systems Architecture at Managed Solution explained that the number one challenge that companies face is knowing what data they are collecting in the first place: “The challenges arise when you are keeping data that you do not need anymore. Do not be a data pack rat, know what you have and delete what you do not need.”
The debate was very lively as the audience had a lot of questions and examples for the panel, demonstrating that new data privacy laws bring uncertainty. Therefore, every business should make sure they know in what way the privacy laws affect them and the data they collect and store.[/vc_column_text][grve_callout button_text="Apply here" button_link="url:https%3A%2F%2Fmanagedsolut.wpengine.com%2Fcontact-us%2F||target:%20_blank|"]To help you make first steps towards the CCPA, we offer a free 30 min consultation with our data privacy guru Robert Meyers, CISM, CIPP/E.[/grve_callout][/vc_column][/vc_row]
Data is an omnipresent element within every organization. Data comes in from customers, employees, third-parties, or other external sources. It is up to each company to find ways on how to handle rapidly growing data and put it to good use. Smart businesses are already looking into ways how this data can address numerous issues within the organization and outside it, as well as how to differentiate themselves from the competition.
Some challenges arise when it comes to leveraging this information. With the many technological advancements over the past two decades, the amount of information coming in is growing at an almost exponential rate. What's more, most of this data is unstructured.
Structured data is much easier to handle. Businesses use it every day by making use of relational databases or by creating spreadsheets in Excel, to give a couple of examples. When this happens, various patterns emerge and can be easily identified.
The biggest issue in this context, however, is with unstructured data. It can come from numerous sources such as social media, emails, documents, blogs, videos, images, etc., and represent ample opportunities for businesses to grow and optimize their operations.
Unfortunately, however, unstructured data makes it much more difficult to gain any easy or straightforward insight by using conventional systems. What's more, much of the data that's generated nowadays is unstructured, making it vital for businesses to find ways on how to properly leverage it.
Cloud Migration
First things, first. With the overwhelming amount of data coming in on a daily basis, storing it on-site can become quite costly. On the one hand, having this data on-site can result in an over-provision, leading to further unnecessary costs. On the other hand, it can take a lot on onsite real-estate.
But by migrating your application and database to the cloud, none of the problems mentioned above will be an issue. With public cloud vendors such as AWS and Microsoft, you can pay as you go, meaning that you will have access to a much higher degree of flexibility and scalability than otherwise. In addition, keep in mind that a cloud provider will become an extension of your IT team once you've made the transition. And let's not forget that storing your data in the cloud also implies less real-estate expense.
Cognitive Computing
Cognitive computing (CC) refers to various technology platforms that make use of artificial intelligence (AI) and signal processing. These platforms also make use of machine learning, natural language processing (NLP), reasoning, speech recognition, human-computer interaction, dialog generation, among other such technologies.
CC can analyze unstructured data, interpret it, and generate insights based on all possible decisions using evidential support. These systems can be adaptive, meaning that they can learn as the information changes. They can also be interactive, seamlessly communicating with users as well as other devices and cloud services. And they can be contextual, in that they can understand, identify, and extract various contextual elements, from multiple sources and different sensory inputs such as visual, auditory, gestural, etc.
In short, cognitive computing will help businesses understand and structure disorderly data to put it to good use and get ahead of the competition.
Conclusion
Big data can offer plenty of opportunities for growth and profitability, but it can also pose a severe challenge if not leveraged correctly. For more information on the topic of data management and other related issues, visit our website or contact us directly.
[vc_row][vc_column][vc_column_text]
New search analytics for Azure Search
One of the most important aspects of any search application is the ability to show relevant content that satisfies the needs of your users. Measuring relevance requires combining search results with the app side user interactions, and it can be hard to decide what to collect and how to do it. This is why we are excited to announce our new version of Search Traffic Analytics, a pattern on how to structure, instrument, and monitor search queries and clicks, that will provide you with actionable insights about your search application. You’ll be able to answer common questions, like most clicked documents or most common queries that do not result in clicks, as well as provide evidence for other situations, like deciding on the effectiveness of a new UI layout or tweaks on the search index. Overall, this new tool will provide valuable insights that will let you make more informed decisions.
Let’s expand on the scoring profile example. Let’s say you have a movies site and you think your users usually look for the newest releases, so you add a scoring profile with a freshness function to boost the most recent movies. How can you tell this scoring profile is helping your users find the correct movies? You will need information on what your users are searching for, the content that is being displayed and the content that your users select. When you have the data on what your users are clicking, you can create metrics to measure effectiveness and relevance.
Our solution
To obtain rich search quality metrics, it’s not enough to log the search requests; it’s also necessary to log data on what users are choosing as the relevant documents. This means that you need to add telemetry to your search application that logs what a user searches for and what a user selects. This is the only way you can have information on what users are really interested on and wether they are finding what they are looking for. There are many telemetry solutions available and we didn't invent yet another one. We decided to partner with Application Insights, a mature and robust telemetry solution, available for multiple platforms. You can use any telemetry solution to follow the pattern that we describe, but using Application Insights lets you take advantage of the Power BI template created by Azure Search.
The telemetry and data pattern consists of 4 steps:
1. Enabling Application Insights
2. Logging search request data
3. Logging users’ clicks data
4. Monitoring in Power BI desktop
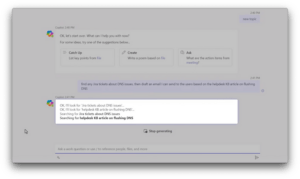
Because it’s not easy to decide what to log and how to use that information to produce interesting metrics, we created a clear set schema to follow, that will immediately produce commonly asked for charts and tables out of the box on Power BI desktop. Starting today, you can access the easy to follow instructions on the Azure Portal and the official documentation.

Once you instrument your application and start sending the data to your instance of Application Insights, you will be able to use Power BI to monitor the search quality metrics. Upon opening the Power BI desktop file, you’ll find the following metrics and charts:
• Clickthrough Rate (CTR): ratio of users who click on a document to the number of total searches.
• Searches without clicks: terms for top queries that register no clicks.
• Most clicked documents: most clicked documents by ID in the last 24 hours, 7 days and 30 days.
• Popular term-document pairs: terms that result in the same document clicked, ordered by clicks.
• Time to click: clicks bucketed by time since the search query.

Operational Logs and Metrics
Monitoring metrics and logs are still available. You can enable and manage them in the Azure Portal under the Monitoring section.
Enable Monitoring to copy operation logs and/or metrics to a storage account of your choosing. This option lets you integrate with the Power BI content pack for Azure Search as well as your own custom integrations.
If you are only interested in Metrics, you don’t need to enable monitoring as metrics are available for all search services since the launch of Azure Monitor, a platform service that lets you monitor all your resources in one place.
Next steps
Follow the instructions in the portal or in the documentation to instrument your app and start getting detailed and insightful search metrics.
[/vc_column_text][/vc_column][/vc_row]
[vc_row][vc_column][vc_column_text]
Introducing #AzureAD Pass-Through Authentication and Seamless Single Sign-on
Howdy folks,
Today’s news might well be our biggest news of the year. Azure AD Pass-Through Authentication and Seamless Single Sign-on are now both in public preview!
When we talk to organizations about how they want to integrate their identity infrastructure to the cloud, we often hear the same set of requirements: “I’ve got to have single sign-on for my users, passwords need to stay on-premises, and I can’t have any un-authenticated end points on the Internet. And make sure it is super easy”.
We heard your feedback, and now the wait is over. I’m excited to announce we have added a set of new capabilities in Azure AD to meet all those requirements: Pass-Through Authentication and Seamless Single Sign-on to Azure AD Connect! These new capabilities allow customers to securely and simply integrate their on-premises identity infrastructure with Azure AD.
Azure AD pass-through authentication
Azure AD pass-through authentication provides a simple, secure, and scalable model for validation of passwords against your on-premises Active Directory via a simple connector deployed in the on-premises environment. This connector uses only secure outbound communications, so no DMZ is required, nor are there any unauthenticated end points on the Internet.
That’s right. User passwords are validated against your on-premises Active Directory, without needing to deploy ADFS servers!
We also automatically balance the load between the set of available connectors for both high availability and redundancy without requiring additional infrastructure. We made the connector super light-weight so it can be easily incorporated into your existing infrastructure and even deployed on your Active Directory controllers.
The system works by passing the password entered on the Azure AD login page down to the on-premises connector. That connector then validates it against the on-premises domain controllers and returns the results. We’ve also made sure to integrate with self-service password reset (SSPR) so that, should the user need to change their password, it can be routed back to on-premises for a complete solution. There is absolutely no caching of the password in the cloud. Find more details about this process in our documentation.
Seamless single sign-on for all
Single sign-on is one of the most important aspects of the end-user experience our customers think through as they move to cloud services. You need more than just single sign-on for interactions between cloud services – you also need to ensure users won’t have to enter their passwords over and over again.
With the new single sign-on additions in Azure AD Connect you can enable seamless single sign-on for your corporate users (users on domain joined machines on the corporate network). In doing so, users are securely authenticated with Kerberos, just like they would be to other domain-joined resources, without needing to type passwords.
The beauty of this solution is that it doesn’t require any additional infrastructure on-premises since it simply uses your existing Active Directory services. This is also an opportunistic feature in that if, for some reason, a user can’t obtain a Kerberos ticket for single sign-on, they will simply be prompted for their password, just as they are today. It is available for both password hash sync and Azure AD pass-through authentication customers. Read more on seamless single sign-on in this documentation article
Enabling these new capabilities
Download the latest version of Azure AD Connect now to get these new capabilities! You’ll find the new options in a custom install for new deployments, or, for existing deployments, when you change your sign-in method.

The fine print
As with all previews there are some limits to what we currently support. We are working hard to ensure we provide full support across all systems. You can find the full list of supported client and operating systems in the documentation, which we’ll be updating consistently as things change.
Also, keep in mind that this is an authentication feature, so it’s best to try it out in a test environment to ensure you understand the end-user experience and how switching from one sign-on method to another will change that experience.
And last but by no means least, it’s your feedback that pushes us to make improvements like this to our products, so keep it coming. I look forward to hearing what you think!
Best regards,
Alex Simons
[/vc_column_text][/vc_column][/vc_row]
[vc_row][vc_column][vc_column_text]
Wireless Subscribers Used 10 Trillion Megabytes of Data Last Year
By Aaron Pressman
Wireless subscribers used almost 10 trillion megabytes of data last year, more than double what they consumed in 2014, as the insatiable appetite for checking Facebook updates, watching YouTube videos, and uploading Snapchat stories continued to fuel growth.
There were also 228 million smartphones in use by the end of 2015, up 10% from a year earlier, CTIA, the wireless industry trade group, said in its annual survey report released on Monday. Counting all kinds of phones and other devices like tablets, the industry counted 378 million active devices at year-end, up 6% from 2014.
Data traffic growth dramatically outpaced increases in other wireless services, the group reported. Minutes of talking increased 17% to 2.8 trillion minutes and the number of text and MMS messages grew less than 2% to 2.1 trillion. Data traffic increased 138% to 9.6 trillion megabytes, or the equivalent of streaming 59,219 videos every minute.
Even with the massive growth in usage, Americans don’t always end up using all the data they pay for, according to some studies. One review of wireless bills estimated that 85% of consumers spent more than necessary for data plans and left unused 1.6 GB per month on average.
The CTIA survey data comes as the industry is fighting federal net neutrality rules that require wireless carriers to treat data traffic equally, limiting their ability to charge major Internet sites and services for reaching customers. A decision on the legality of the rules is expected any day from the U.S. Court of Appeals in Washington, D.C. At the same time, the industry is expected to spend $30 billion or more on new spectrum licenses at an upcoming auction to help relieve network congestion in the most populated areas.
Industrywide wireless revenue increased only 2% to $192 billion in 2015, the group said.
Almost half of all U.S. households rely solely on mobile phones and have cancelled their landlines, the group said. Wireless-only households exceeded 48% at the end of the year, up from just 8% ten years ago.
The industry continued to blanket the countryside with cell towers, with the number of cell sites reaching almost 308,000 at the end of the year, up 3% from the year before.
CTIA members represent 97% of the industry, including all four of the largest mobile companies, AT&T, Verizon Communications, T-Mobile, and Sprint.
[/vc_column_text][/vc_column][/vc_row]
[vc_row][vc_column][vc_column_text]
Passwords for 32M Twitter accounts may have been hacked and leaked
By Catherine Shu and Kate Cogner as written on techcrunch.com

There is yet another hack for users of popular social media sites to worry about. Hackers may have used malware to collect more than 32 million Twitter login credentials that are now being sold on the dark web. Twitter says that its systems have not been breached.
“We are confident that these usernames and credentials were not obtained by a Twitter data breach – our systems have not been breached. In fact, we’ve been working to help keep accounts protected by checking our data against what’s been shared from recent other password leaks,” a Twitter spokesperson said.
LeakedSource, a site with a search engine of leaked login credentials, said in a blog post that it received a copy of the user information from “Tessa88@exploit.im,” the same alias used by the person who gave it hacked data from Russian social network VK last week.
Other major security compromises which have hit the news recently include a Myspace hack that involved over 360 million accounts, possibly making it the largest one ever, and the leak of 100 million LinkedIn passwords stolen in 2012.
LeakedSource says the cache of Twitter data contains 32,888,300 records, including email addresses, usernames, and passwords. LeakedSource has added the information to its search engine, which is paid but lets people remove leaked information for free.
Based on information in the data (including the fact that many of the passwords are displayed in plaintext), LeakedSource believes that the user credentials were collected by malware infecting browsers like Firefox or Chrome rather than stolen directly from Twitter. Many of the affected users appear to be in Russia—six of the top 10 email domains represented in the database are Russian, including mail.ru and yandex.ru.
Even though Mark Zuckerberg got several of his non-Facebook social media accounts hacked this week, including Twitter, his information wasn’t included in this data set, LeakedSource claims. Zuckerberg was ridiculed for appearing to reuse “dadada” as his password on multiple sites, but results from LeakedSource’s data analysis shows that many people are much less creative. The most popular password, showing up 120,417 times, was “123456,” while “password” appears 17,471 times. An analysis of the VK data also turned up similar results.
In a statement to TechCrunch, Twitter suggested that the recent hijacking of accounts belonging to Zuckerberg and other celebrities was due to the re-use of passwords leaked in the LinkedIn and Myspace breaches.
“A number of other online services have seen millions of passwords stolen in the past several weeks. We recommend people use a unique, strong password for Twitter,” a Twitter spokesperson said. Twitter suggests that users follow the suggestions in its help center to keep their accounts secure. Twitter also posted on its @Support account that it is auditing its data against recent database dumps.

LeakedSource said that it determined the validity of the leaked data by asking 15 users to verify their passwords. All 15 confirmed that the passwords listed for their accounts were correct. However, experts cautioned that the data may not be legitimate.
Michael Coates, Twitter’s trust and information security officer, tweeted that he is confident the social media platform’s systems have not been compromised.
“We securely store all passwords w/ bcrypt,” Coates added, referencing a password hashing function considered secure. “We are working with LeakedSource to obtain this info & take additional steps to protect users,” he continued.
Troy Hunt, the creator of a site that catalogs breaches called haveibeenpwned.com, also expressed skepticism about the authenticity of the data. Hunt told TechCrunch that he’d heard rumors of breaches at Twitter and Facebook for several weeks but had yet to see convincing proof. “They may well be old leaks if they’re consistent with the other big ones we’ve seen and simply haven’t seen the light of day yet. Incidentally, the account takeovers we’ve seen to date are almost certainly as a result of credential reuse across other data breaches,” Hunt said.
Whether or not the leaked Twitter credentials are authentic, it never hurts to change your password — especially if you use the same password across several sites. Turning on two-factor authentication also helps keep your account secure, even if your password is leaked.
[/vc_column_text][/vc_column][/vc_row]
[vc_row][vc_column][vc_column_text]
Recently confirmed Myspace hack could be the largest yet
By Sarah Perez as written on techcrunch.com
You might not have thought of – much less visited – Myspace in years. (Yes, it’s still around. Time, Inc. acquired it and other properties when it bought Viant earlier this year.) But user data never really dies, unfortunately. For Myspace’s new owner, that’s bad news, as the company confirmed just ahead of the Memorial Day holiday weekend in the U.S., that it has been alerted to a large set of stolen Myspace username and password combinations being made available for sale in an online hacker forum.
The data is several years old, however. It appears to be limited to a portion of the overall user base from the old Myspace platform prior to June 11, 2013, at which point the site was relaunched with added security.
Time, Inc. didn’t confirm how many user accounts were included in this data set, but a report from LeakedSource.com says that there are over 360 million accounts involved. Each record contains an email address, a password, and in some cases, a second password. As some accounts have multiple passwords, that means there are over 427 million total passwords available for sale.
Despite the fact that this data breach dates back several years, the size of the data set in question makes it notable. Security researchers at Sophos say that this could be the largest data breach of all time, easily topping the whopping 117 million LinkedIn emails and passwords that recently surfaced online from a 2012 hack.
That estimation seems to hold up – while there are a number of other large-scale data breaches, even some of the biggest were not of this size. The U.S. voter database breach included 191 million records, Anthem’s was 80 million, eBay was 145 million, Target was 70 million, Experian 200 million, Heartland 130 million, and so on.
The issue with these older data breaches is that they’re from an era where security measures were not as strong as today. That means these passwords are easily cracked. LeakedSource notes that the top 50 passwords from those cracked account for over 6 million passwords – or 1.5 percent of the total, to give you a sense of scale.
The passwords were stored as unsalted SHA-1 hashes, as LinkedIn’s were, too.
That allowed Time, Inc. to date the data breach to some extent, as the site was relaunched in June 2013 with strengthened account security, including double-salted hashes to store passwords. It also confirmed that the breach has no effect on any of its other systems, subscriber information, or other media properties, nor did the leaked data include any financial information.
Myspace is notifying users and has already invalidated the passwords of known affected accounts.
The company is also using automated tools to attempt to identify and block any suspicious activity that might occur on Myspace accounts, it says.
“We take the security and privacy of customer data and information extremely seriously—especially in an age when malicious hackers are increasingly sophisticated and breaches across all industries have become all too common,” said Myspace’s CFO Jeff Bairstow, in a statement. “Our information security and privacy teams are doing everything we can to support the Myspace team.”
However, while the hack itself and the resulting data set may be old, there could still be repercussions. Because so many online users simply reuse their same passwords on multiple sites, a hacker who is able to associate a given username or email with a password could crack users’ current accounts on other sites.
Of course, it’s not likely users even remember what password they used on Myspace years ago, which makes protecting your current accounts more difficult. A better option is to always use more complicated passwords, reset them periodically, and take advantage of password management tools like Dashlane or LastPass to help you keep track of your logins.
Myspace also confirmed that the hack is being attributed to the Russian cyberhacker who goes by the name “Peace.” This is the same person responsible for the LinkedIn and Tumblr attacks, too. In Tumblr’s case, some 65 million plus accounts were affected. But these passwords were “salted,” meaning they are harder to crack.
Myspace is working with law enforcement as this case is still under investigation, the company says.
[/vc_column_text][/vc_column][/vc_row]


